Sage Data & Analytics Will Make Your World a Better Place. We promise.

Have you been in a situation where you know you could make life easier in the long term if you just stopped and took action in the short term? Of course, it’s hard when you’re busy to stop and take a moment, but sometimes just a few minutes can have ripple effects that lead to long-term time savings.
Okay, that was a long-winded way of saying — it’s time to start using the dashboard functionality in Sage Data & Analytics (SD&A) because it’s going to save you a ton of time and headaches. We’ve introduced you to SD&A before and taken a deeper dive in to how it can positively impact your financial report tasks. This time, we want to highlight one particular feature of Sage Data & Analytics — the dashboard.
Watch the on-demand webinar: Sage Data & Analytics for Sage 100 – Your Powerful BI Toolkit.
Designed for Sage 100 Users
SD&A has a pre-built integration to play with Sage 100, so you can bypass the complexities associated with implementing other BI applications. There’s no specific technical knowledge needed. SD&A is a cloud-based application that can be implemented fast. It’s designed to read your Sage 100 database, whether that database resides on your own in-house server or on a partner-hosted platform. SD&A comes with preconfigured dashboards, so you can rapidly begin sharing and leveraging valuable business data.
Key Metrics Always on Hand
Business data is most valuable when it’s current, accurate, and accessible. The SD&A dashboard functionality delivers on all three counts. The dashboards receive updated data in real-time, straight from your Sage 100 database, and present the data in the form of clear, easily digestible graphics.
We think of dashboards as empowering for users and timesaving for you, since users can quickly access the data they care about without coming to you to run a report or update a spreadsheet.
A Dashboard for Everyone
There are dashboards appropriate for every role and every Sage 100 user – from the CFO, the VP of Sales, to the Inventory Manager. It’s easy to customize the dashboards and build out new ones too. While SD&A dashboards provide a quick, big picture view, you can click on any value and drill down into the details that make up that value.

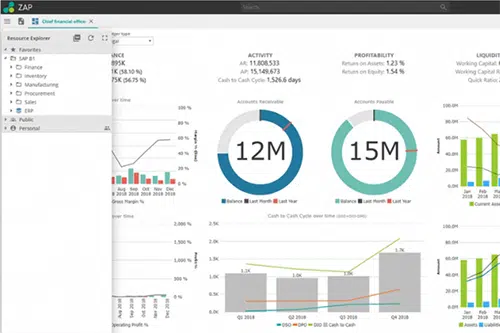
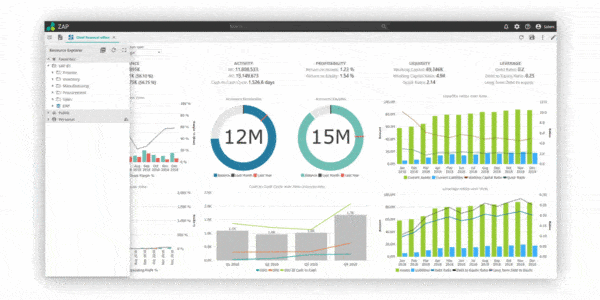
The CFO dashboard, for example, includes high-level AP and AR activity data, profitability metrics, and liquidity and leverage stats. It’s an at-a-glance look at the financial health of your organization that busy CFOs crave.
The VP of Sales will find their dashboard contains up-to-date stats measuring actual-to-target sales by quarter and year, sales trends over time, and average customer margins.
Inventory Managers can stay out in front with a dashboard that shows critical information like inventory turn, valuation, top sellers, and movement trends.
Reasons to Love SD&A
We asked our consulting team to share the reasons they love SD&A, and here are their top three.
- The best Business Intelligence – SD&A gives you a full suite of pre-packaged, customizable, and easy-to-use reports and data visualizations right out of the box. No programming or coding is required.
- Based on the best technology – Cloud-hosted and browser-based, SD&A is accessible on your mobile, tablet, or desktop. The highest-grade data security, privacy, governance, maintenance, and upgrades are built in and automated.
- Now and for the future – Straight away, SD&A will save the average Sage 100 user more than 10 hours a week on report preparation. You’ll get a 360-degree view of your business today and a decision-making infrastructure that will scale with your business as it evolves.
We know you’re busy but trust us. Spend a few moments getting familiar with SD&A dashboards, and you’ll save time you used to spend answering all the requests for information that zap your energy now. Watch the on-demand webinar, Sage Data & Analytics For Sage 100 – Your Powerful BI Toolkit, to see SD&A dashboards in action. Or contact us for a demo.


